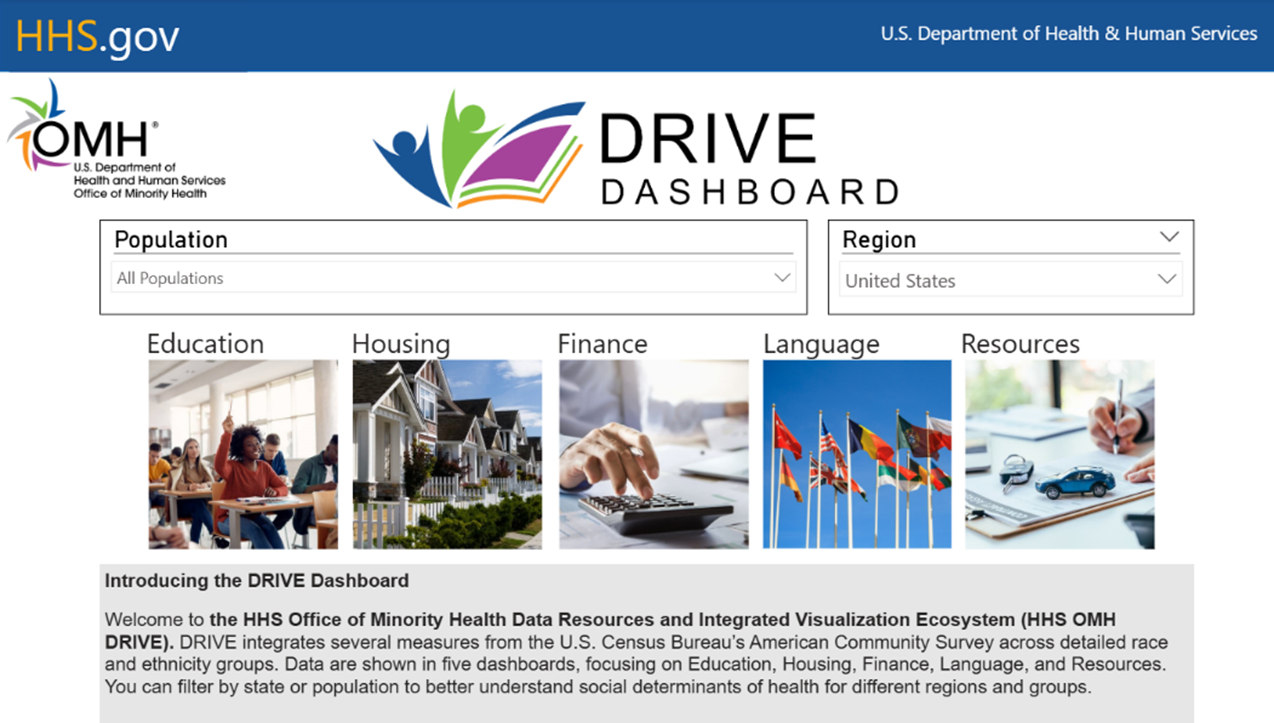
The U.S. Department of Health and Human Services (HHS) Office of Minority Health (OMH) Data Resources and Integrated Visualization Ecosystem (DRIVE) is an interactive data visualization dashboard that integrates several measures from the U.S. Census Bureau’s American Community Survey (ACS) across multiple population groups at national and state levels. OMH DRIVE is a user-friendly tool that provides dynamic data visualizations for socioeconomic indicators and non-medical drivers of health. Unique from other data tools, OMH DRIVE allows data to be explored and visualized for specific race and ethnicity groups.
OMH DRIVE includes data dashboards for five key factors related to health:

Education

Housing

Finance

Language

Other Resources
Each dashboard supports filtering by population group and geographic location, allowing users to view tailored data charts for selected metrics related to the dashboard topic. OMH DRIVE also allows users to compare data across populations and regions.
Access the OMH DRIVE Dashboard

Use OMH DRIVE to compare data across populations, regions, and selected metrics.
How to use the OMH DRIVE Dashboard
Navigating the OMH DRIVE Home Page
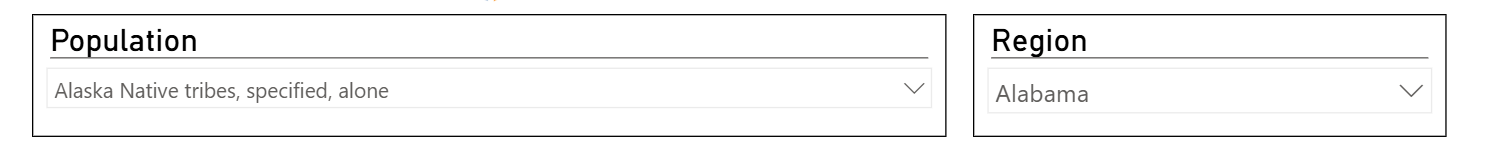
Use the drop-down menu to select a Population. The population groups in the menu are from the ACS Selected Population Profile. Data are available for some populations only. You can select one population group or select All Populations for available data for all the population groups.
- Use the drop-down menu to select a Region. Select a state name to view data for a specific state or select United States to view available data for the entire United States. The list will only include states for which data on the population you selected are available.
- Click one of the dashboard boxes to view dashboard reports for Education, Housing, Finance, Language, or Other Resources. The report page will load with data on the combination of population and region you selected.
Education
Housing
Finance
Language
Other Resources
Using the OMH DRIVE Report Page
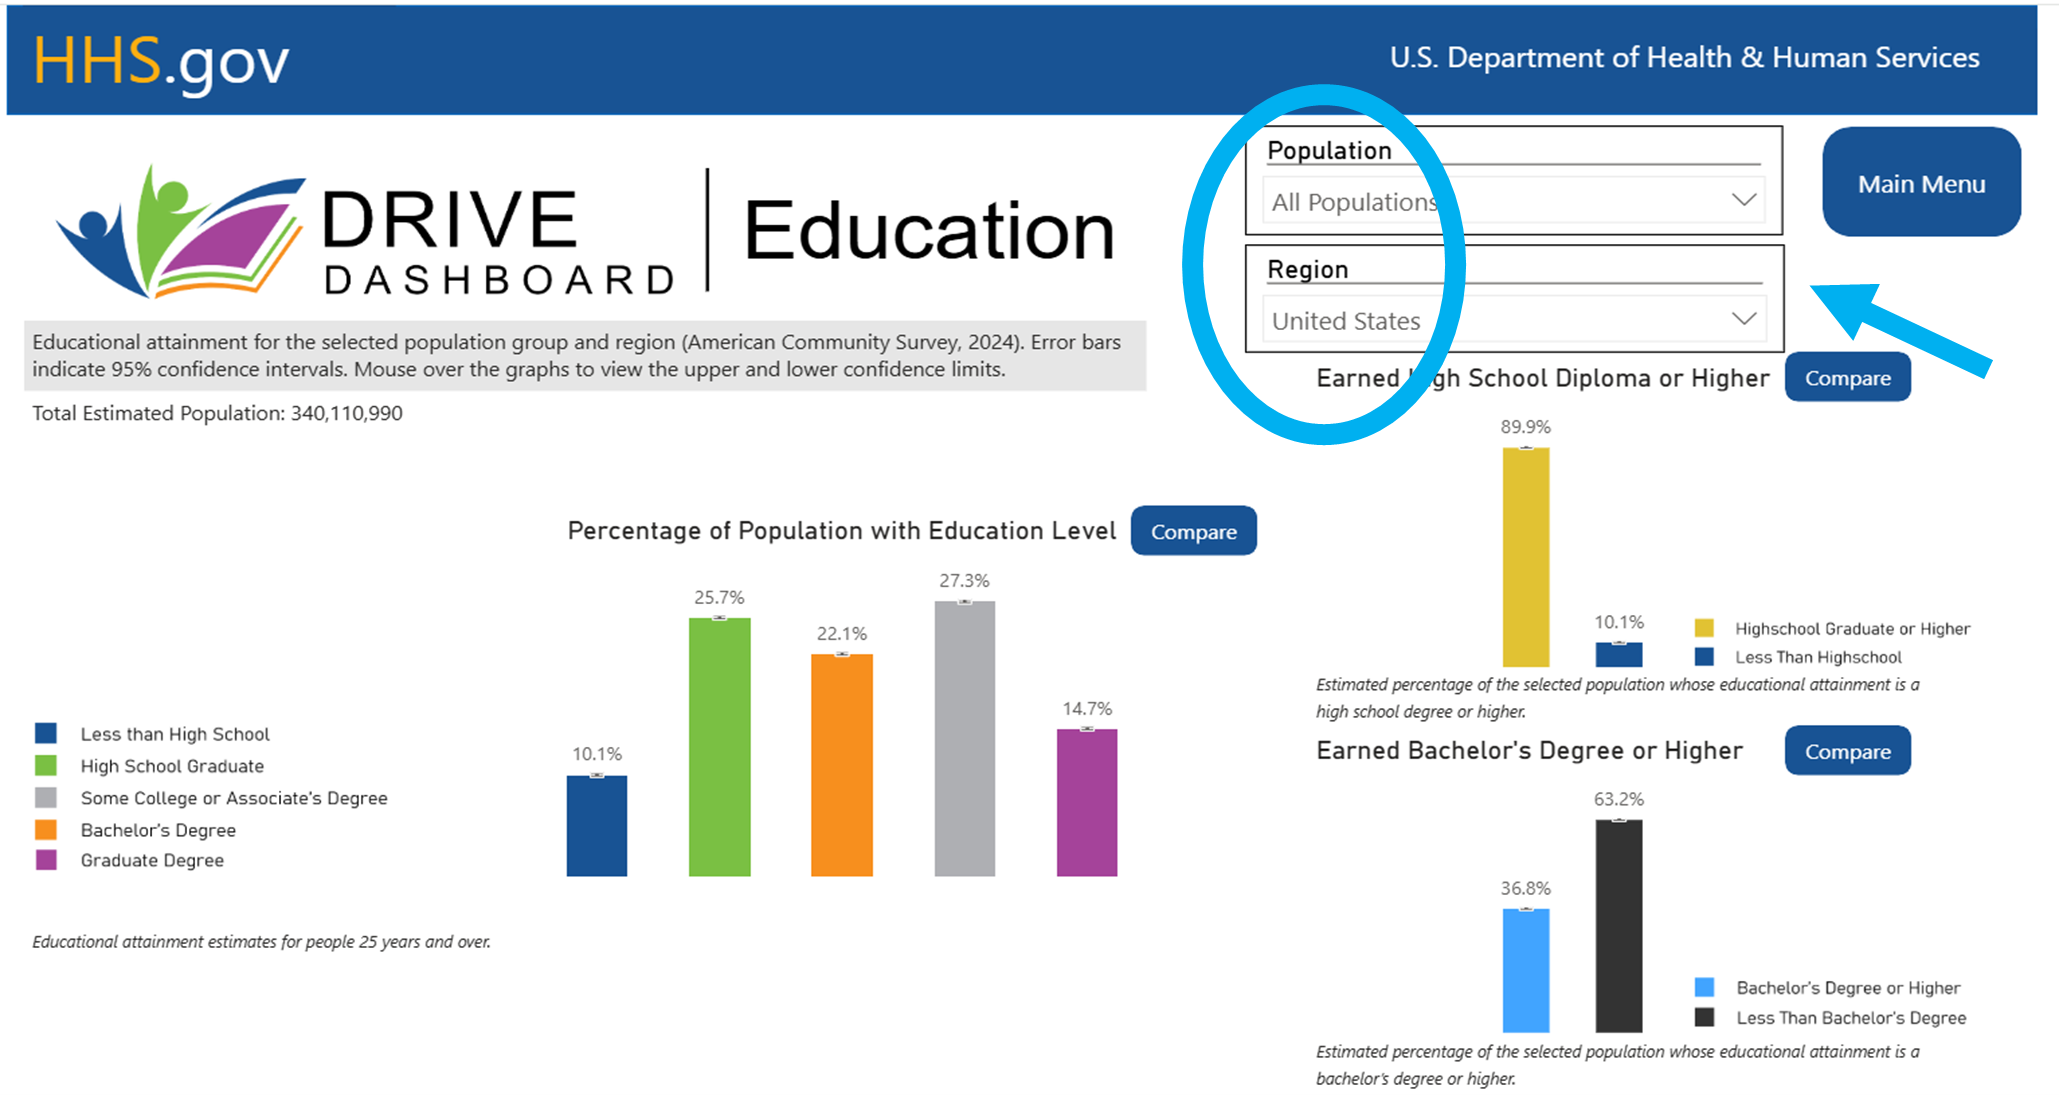
Within a report page, you can use the drop-down menus to filter available data by a different Population and Region without returning to the home page. The charts will update based on the Population and Region selected.
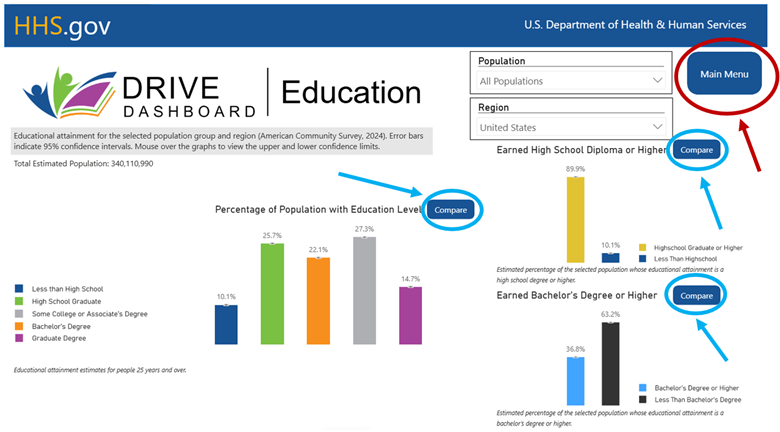
- To compare a metric across two populations and/or regions, click the Compare button next to a chart.
- To go back to the Home Page, click Main Menu.
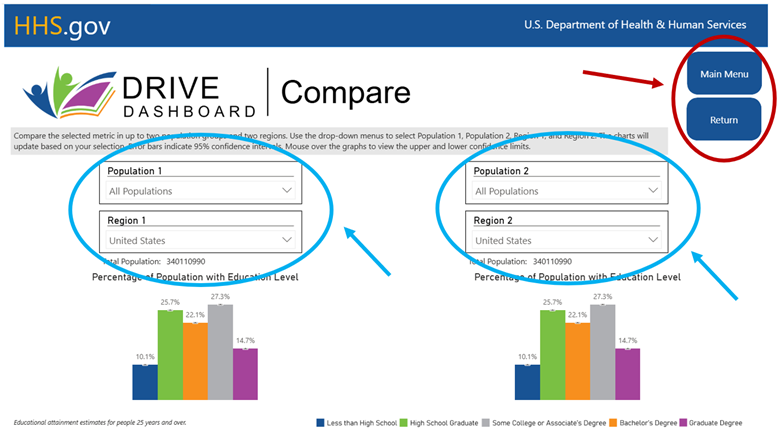
Using the OMH DRIVE Compare View
Within the compare view, you will see two charts and four drop-down menus.
- To update the first chart, use the drop-down menus for Population 1 and Region 1.
- To update the second chart, use the drop-down menus for Population 2 and Region 2.
- You can compare the same population across two regions, two populations within the same region, or two different populations and regions.
- To go back to the Report Page, click Return. To go back to the Home Page, click Main Menu.
Data Exploration Exercises
The purpose of OMH DRIVE is to integrate data from the U.S. Census categories to visualize some commonly used factors or measures in public health and health care. These visualizations can inform individuals, practitioners, and researchers of measures that are relevant to their work and prompt new ideas. OMH DRIVE can help you find relevant ideas and data that can help you with your next project, study, or report. It can be used to inform research, strategic planning, program design, and evaluation related to public health issues.
Here are two data exploration exercises that can be used to visualize real data, prompt ideas, and encourage discussions. Use the OMH DRIVE dashboard factors and regions to answer the questions below:
Exercise 1
Population: Hispanic or Latino
- In the state of Arizona, what is the estimated percentage of Earned High School Diploma or Higher for Hispanic or Latino of any race?
- Where do Hispanic or Latino of any race populations pay a higher Gross Rent (Median)? Colorado or Utah? Arkansas or Delaware?
- What is the Household Income (Median) of Hispanic or Latino of any race in the state of Illinois?
- Where do you find the highest estimated percentage of Languages Other than English between the states of California and New York? Between Florida and Texas?
- What is the estimated percentage of Hispanic or Latino of any race that speak a Language Other than English at home?
- What is the estimated percentage of Private Health Insurance for the Hispanic or Latino of any race population in the United States?
Exercise 2
Region: Kentucky
Use the OMH DRIVE dashboard factors and populations to answer the questions below:
- In Kentucky, do Black or African American Alone (not Hispanic) or people reporting Two or More Races have the highest estimated percentage of Earned Bachelor’s Degree or Higher?
- In Kentucky, among people identified as American Indian/Alaska Native alone and Hispanic/Latino (of any race), what is the estimated percentage of house ownership?
- In Kentucky, what is the estimated Median Income for Female Mexicans compared to Male Asian alone or in combination?
- In Kentucky, what is the estimated percentage of individuals that speak English Less than Very Well?
- Among All Populations in Kentucky, what is the estimated percentage of the Mobile Home, Boat, RV, Van housing category?
Date Last Reviewed: February 2026