What is the Minority Health Index?
Based on the U.S. Centers for Disease Control and Prevention’s Agency for Toxic Substances and Disease Registry (CDC/ATSDR) Social Vulnerability Index (SVI), the Minority Health Index (MHI) is a mapping and data visualization tool that helps emergency response planners and public health officials identify, map, and plan support for communities that will most likely need support before, during, and after a public health emergency. The MHI includes individual and community characteristics such as health care access and chronic disease prevalence. Additionally, the MHI provides county-level data on chronic diseases and healthcare infrastructure to help identify populations in medically underserved areas. The MHI is determined by an index that is calculated from selected demographic indicators (variables). The index provides the relative risk or vulnerability of every county in the United States, ranking counties to determine the relative risk or vulnerability of each community compared to other communities.
The MHI combines medical and non-medical factors organized into six themes.
Theme 1
Socioeconomic Status
Theme 2
Household Characteristics
Theme 3
Racial and Ethnic Minority Status
Theme 4
Housing Type and Transportation
Theme 5
Health Care Infrastructure and Access
Theme 6
Health Risks
The MHI includes statistics for race/ethnicity categories and languages other than English. Specifically, data are included for the five racial and ethnic minority groups currently defined by the 1997 OMB Directive 15 and the top five languages spoken by populations with limited English proficiency (LEP) populations at the county level.
Racial and Ethnic Minority Groups
American Indian or Alaska Native
Asian
Black or African American
Hispanic or Latino
Native Hawaiian or Other Pacific Islander
Languages
Spanish
Chinese
Vietnamese
Arabic
Tagalog
The MHI is derived from publicly available data from the following sources:
- U.S. Census Bureau’s American Community Survey (ACS)
- CDC
- U.S. Department of Homeland Security (DHS)
- Health Resources and Services Administration (HRSA)
The full database includes percentages or counts for each variable along with margins of error (MOE), where applicable, as well as percentile rankings for each theme and overall risks associated with medical and non-medical factors. Data are available for counties within each state and the District of Columbia to enable analysis of relative vulnerability across states and the United States. Full documentation can be found in the Minority Health Index Data Dictionary.
The information presented on this page is disseminated by HHS OMH (not CDC), and it should not be construed as CDC’s determination or policy.
How do I use the Minority Health Index Data Dashboard?
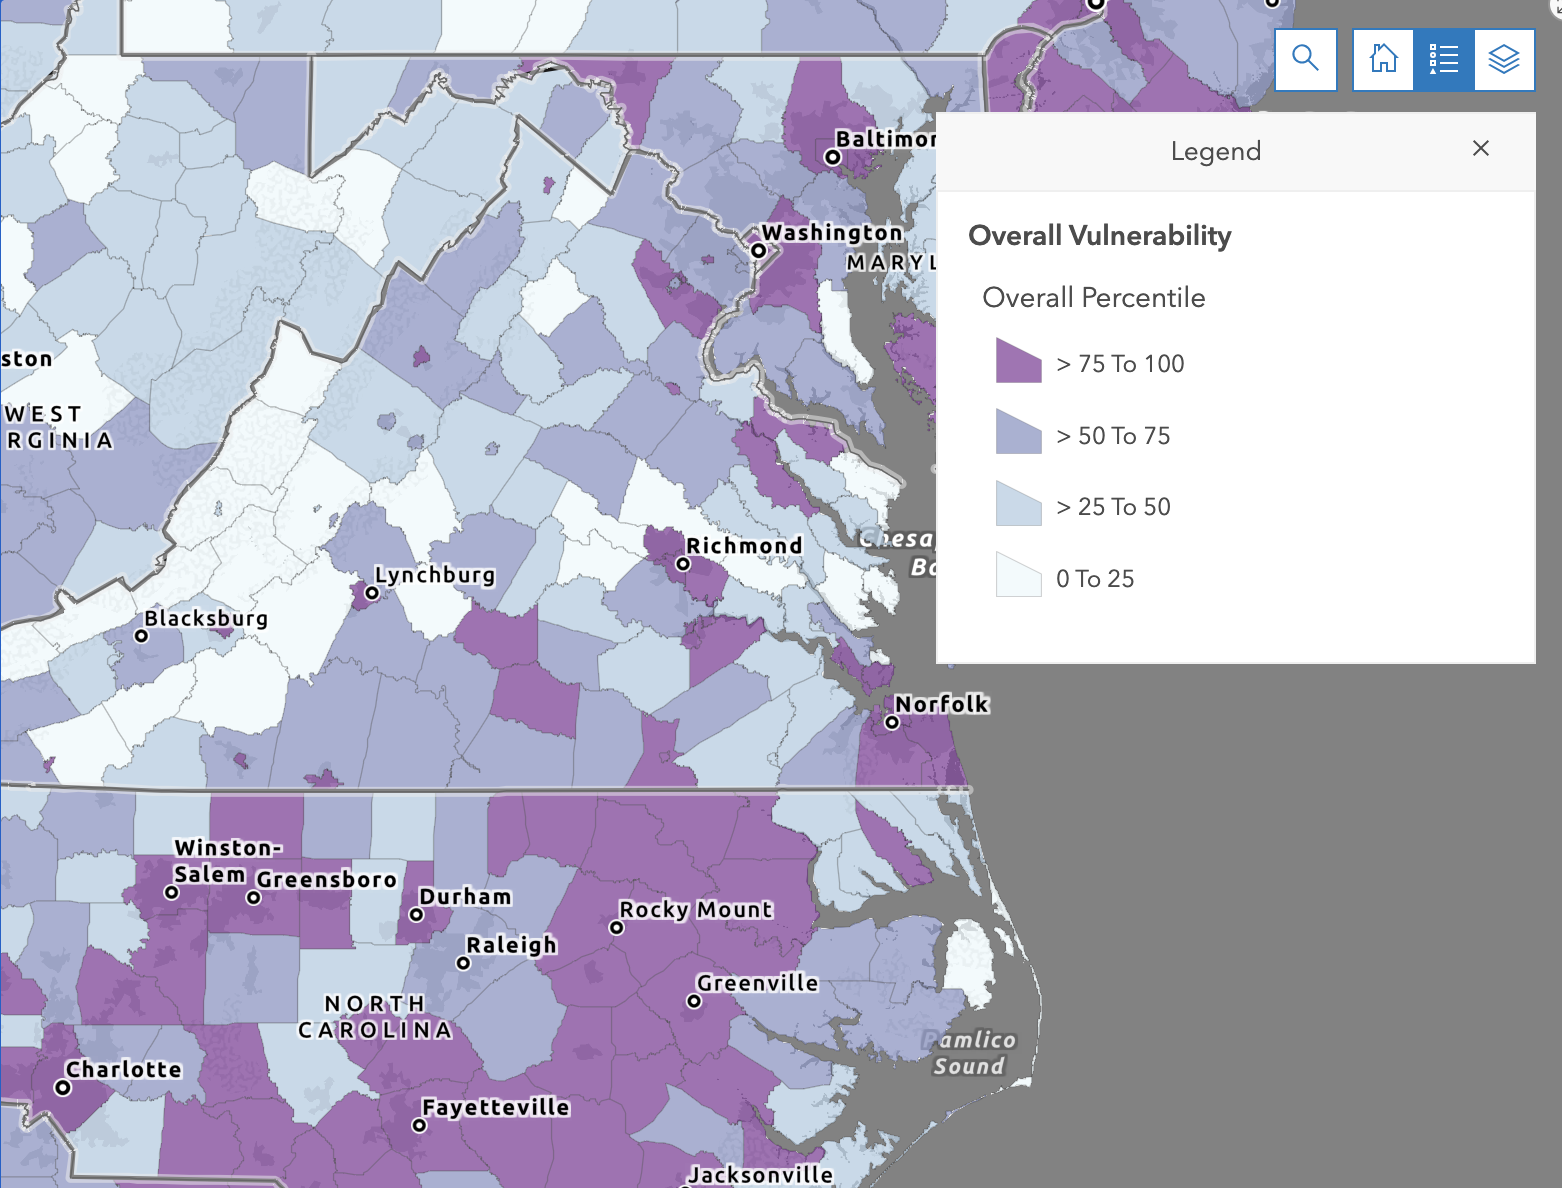
The Minority Health Index Data Dashboard is an interactive platform for users to view and map Minority Health Index variables and index by county. The dashboard is a deployment of Esri ArcGIS Enterprise Operations Dashboard hosted on the CDC OneMap platform. Data visualization features of the dashboard include a map of Minority Health Index percentile rankings by county and a bar chart of mean (average) values for individual variables.
Within the dashboard, users can customize the bar chart through a drop-down menu of variables and can filter the data by state, county, and MHI percentile ranking. For example, if a user selects the “%Below 150% of poverty line variable” and filters to Georgia and All Counties in the top 20 percent for Theme 6 (Health Risks), the chart updates to display the “%Below 150%” of poverty line, the overall vulnerability score and Theme 1 (Socioeconomic Status) in those counties. This interaction makes it possible to look at a subset of counties based on different factors contributing to vulnerability and explore how individual variables change accordingly.
User interaction with the dashboard map can begin with either search criteria or a geographic area of interest. When the user selects a subset of counties with the filter function, the map updates to show only those counties. In this way, a user would be able to identify which counties in Virginia are ranked highest for Health Risks. Conversely, if a user adjusts the map to focus on a geographic region, the chart will update to show the statistics for counties currently visible on the map.
What can I do with the Minority Health Index?
The MHI can be used as the basis for research, strategic planning, program design, and evaluation related to response and recovery for public health emergencies or disease outbreaks. Here are some of the many research questions that users could explore with the MHI dashboard:
- Which counties in California are above the 90th percentile for Socioeconomic Status?
- What is the mean cardiovascular disease mortality in the area surrounding Washington, D.C.?
- For counties with the highest medical risks or vulnerability, what percent of the population, have obesity or diabetes?
The MHI databases and dashboard can also be used to
- Advance chronic disease prevention and other health priorities.
- Plan community-focused intervention efforts.
- Identify communities with individuals that have LEP (and the languages spoken in those communities) who will need language assistance for outreach efforts and services.
- Support program planning and evaluation efforts, including those that may link Minority Health Index with other databases.
- Identify medically under-resourced communities for which strategic efforts are needed to improve health care infrastructure and access.
- Plan community-level efforts to address non-medical drivers of health.
- Help decide how many public health and emergency personnel are required to assist people in case of emergencies at the county level.
- Foster multi-sector collaboration at the community level by offering a tool that addresses place-based risk factors with data.
- Inform the design of tailored programs and services needed to address chronic disease disparities.
- Inform research examining the correlation between socioeconomic, health care infrastructure, and demographic characteristics of an area.
What are the data sources and technical notes for the Minority Health Index?
The MHI includes demographic data from the ACS 5-Year Estimates. The ACS is a survey conducted by the U.S. Census Bureau that collects data from a sample of people in the United States, so the estimates are subject to sampling error. The MHI dataset includes the MOE for each applicable variable based on a 90 percent confidence interval. More information on ACS methods is available in the ACS data user handbook.
It is important to note that the MHI treats health risk or vulnerability factors as characteristics of a community, which is defined here as a county. As is always the case when data are aggregated to a geographic unit, there may be significant spatial variation in health risks within a given county. County-level measures of health risks do not necessarily reflect the experiences of all individuals living in the county.
What changes were made in the latest update to the Minority Health Index?
The MHI was updated in June 2025 to include the latest available data and to align with changes to the 2022 CDC/ATSDR SVI.
Changes to Data
The data sources used in the MHI update periodically. The updated MHI version includes data that have been updated since the 2022 version was released. For example, the 2018-2022 ACS 5-Year Estimates were used for all variables coming from the ACS. See the Minority Health Index Data Dictionary to view the data source for each variable.
Change to Theme 6
The MHI renamed Theme 6 to “Health Risks.” Please refer to the Minority Health Index Data Dictionary for more information on specific variables.
How is the Minority Health Index calculated?
The table below shows the six MHI themes and variables. Full documentation on how the MHI is calculated can be found in the Minority Health Index Data Dictionary.
Theme
MHI Variables
Theme 1 | Socioeconomic Status
- Below 150% Poverty
- Unemployed
- Housing Cost Burden
- No High School Diploma
- No Health Insurance
Theme 2 | Household Characteristics
- ≥65 Years
- ≤17 Years
- Civilian with a Disability
- Single-Parent Households
- Spanish Speakers
- Chinese Speakers
- Other Languages
Theme 3 | Racial and Ethnic Minority Status
- Hispanic or Latino
- Black or African American*
- Asian*
- American Indian or Alaska Native*
- Native Hawaiian or Other Pacific Islander*
- Some Other Race*
- Two or More Races*
Theme 4 | Housing Type and Transportation
- Multi-Unit Structures
- Mobile Homes
- Crowded Housing
- No Vehicle
- Group Quarters
Theme 5 | Health Care Infrastructure and Access
- Hospitals
- Primary Care Physicians
- Without Health Insurance
Theme 6 | Health Risks
- Cardiovascular Disease Mortality
- Obesity
- Diabetes
- Without Internet Access
*Single- and multi-race categories do not include individuals who identified as Hispanic or Latino.
Date Last Reviewed: February 2026