
Data Resources and Integrated Visualization Ecosystem (DRIVE) User Guide

Data Resources and Integrated Visualization Ecosystem (DRIVE) User Guide
Learn how to use OMH DRIVE dashboard sections, filters, available metrics, and comparison tools.
The U.S. Department of Health and Human Services (HHS) Office of Minority Health (OMH) Data Resources and Integrated Visualization Ecosystem (DRIVE) is an interactive data visualization dashboard that integrates several measures from the U.S. Census Bureau’s American Community Survey (ACS) across multiple population groups at national and state levels. OMH DRIVE is a user-friendly tool that provides dynamic data visualizations for socioeconomic indicators and non-medical drivers of health. Unique from other data tools, OMH DRIVE allows data to be explored and visualized for specific race and ethnicity groups.
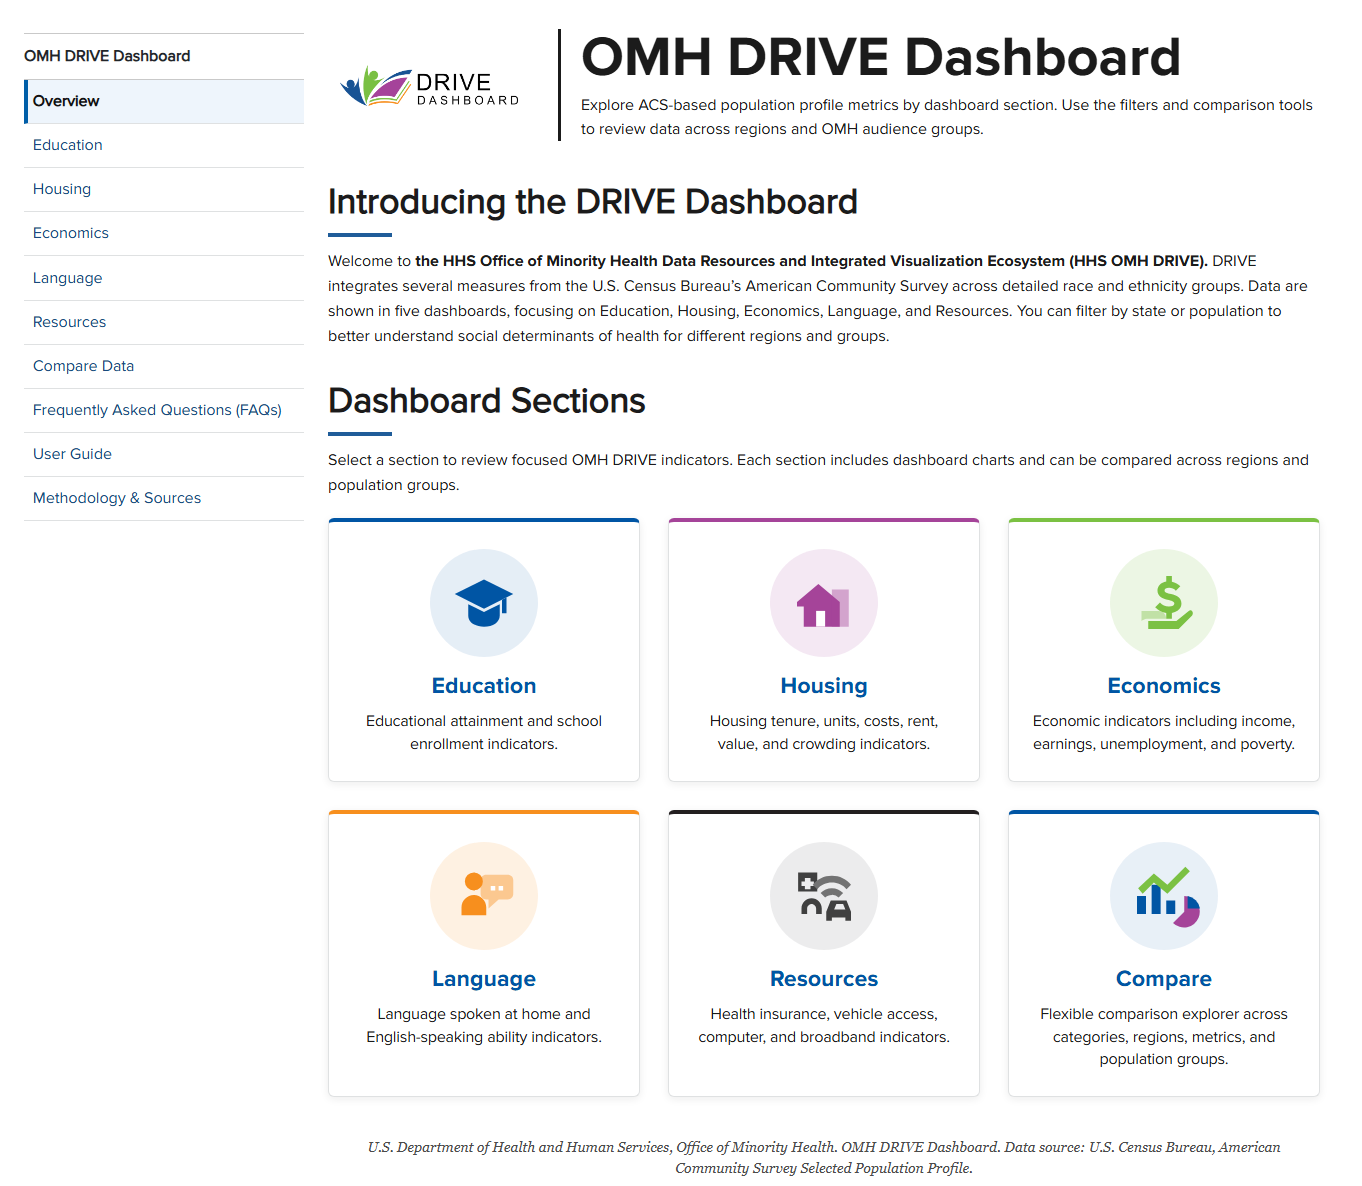
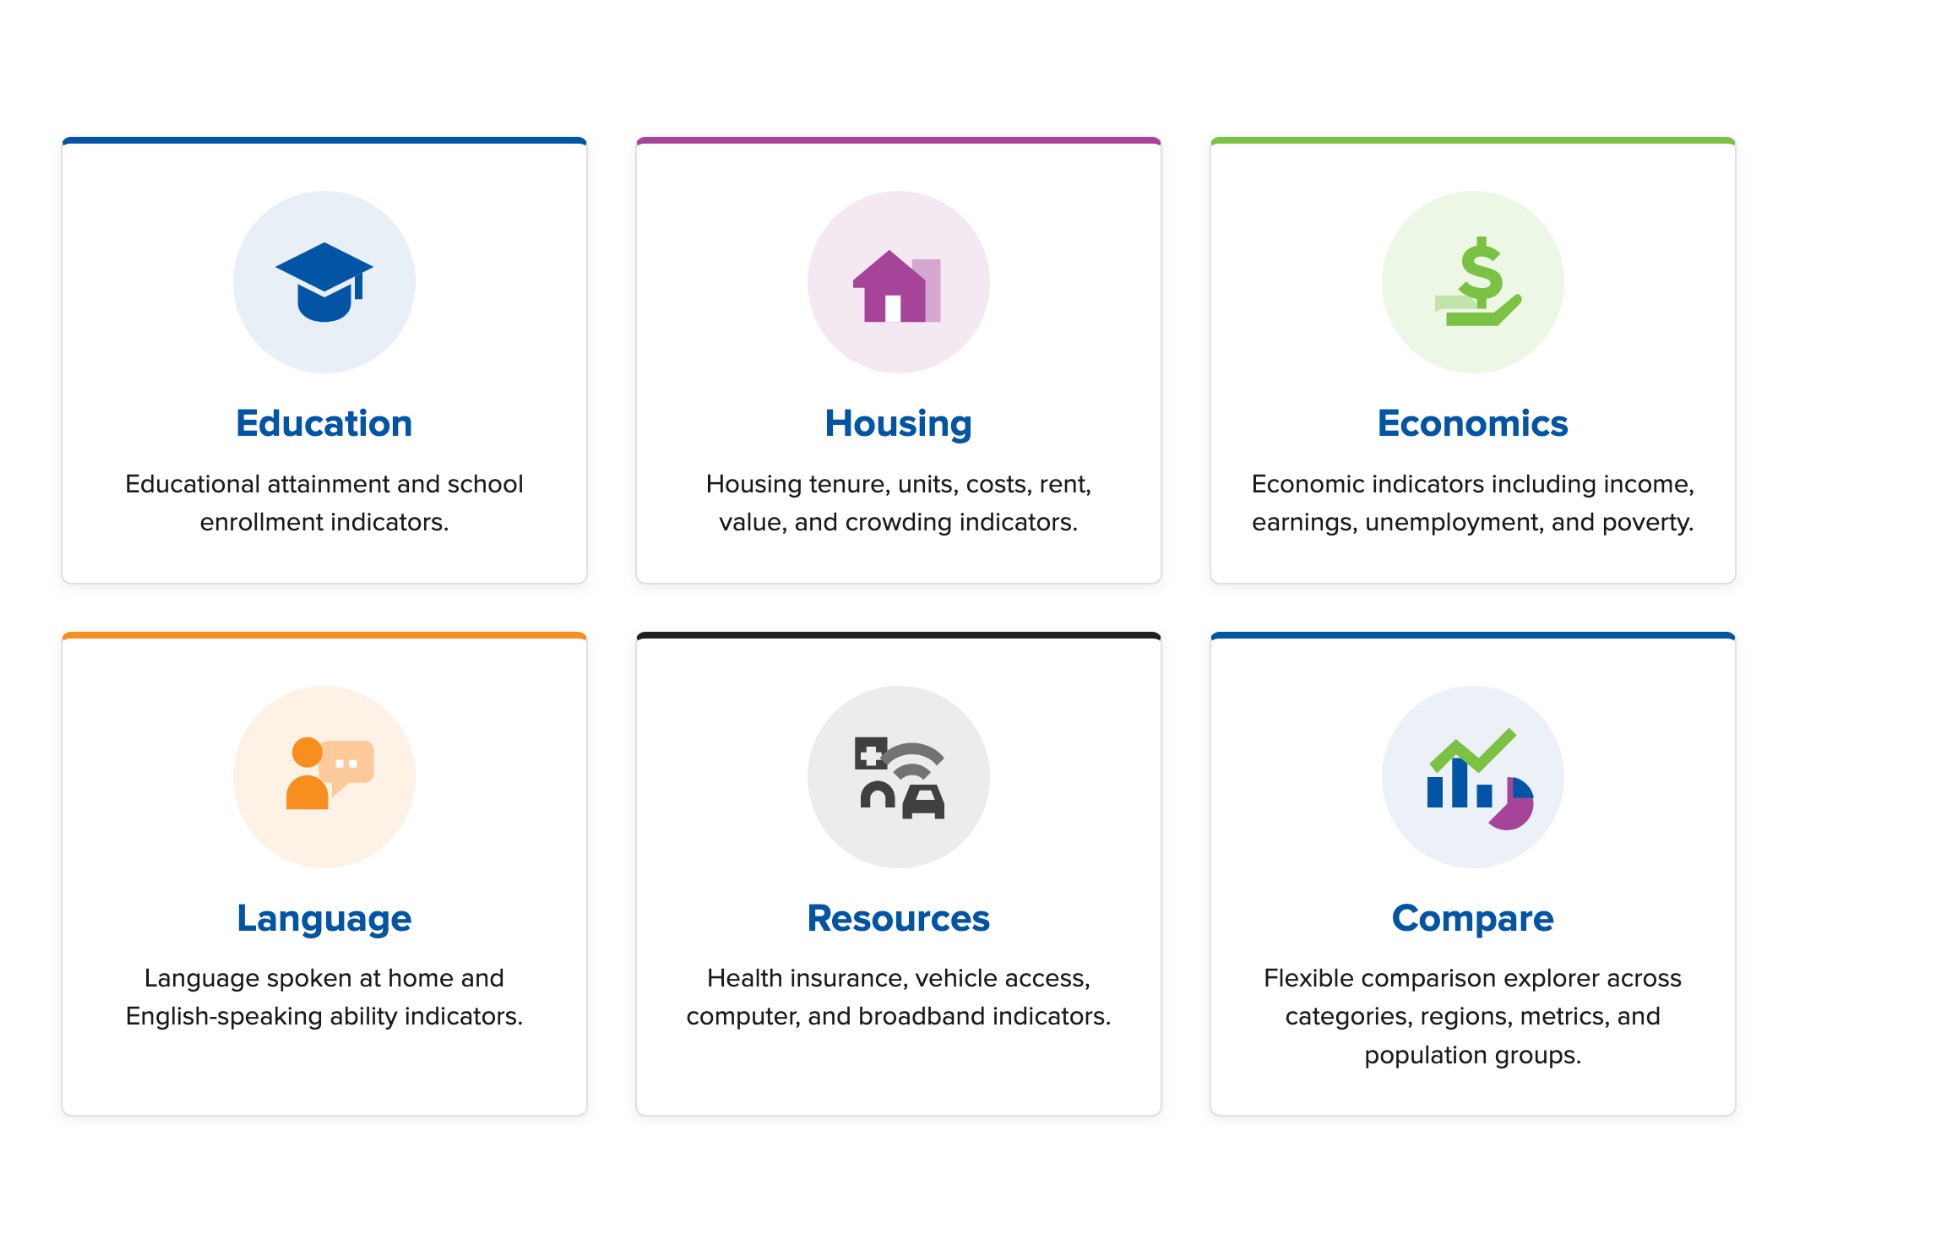
OMH DRIVE includes data dashboards for five key factors related to health and a compare dashboard:
How to use the OMH DRIVE Dashboard
Home Page
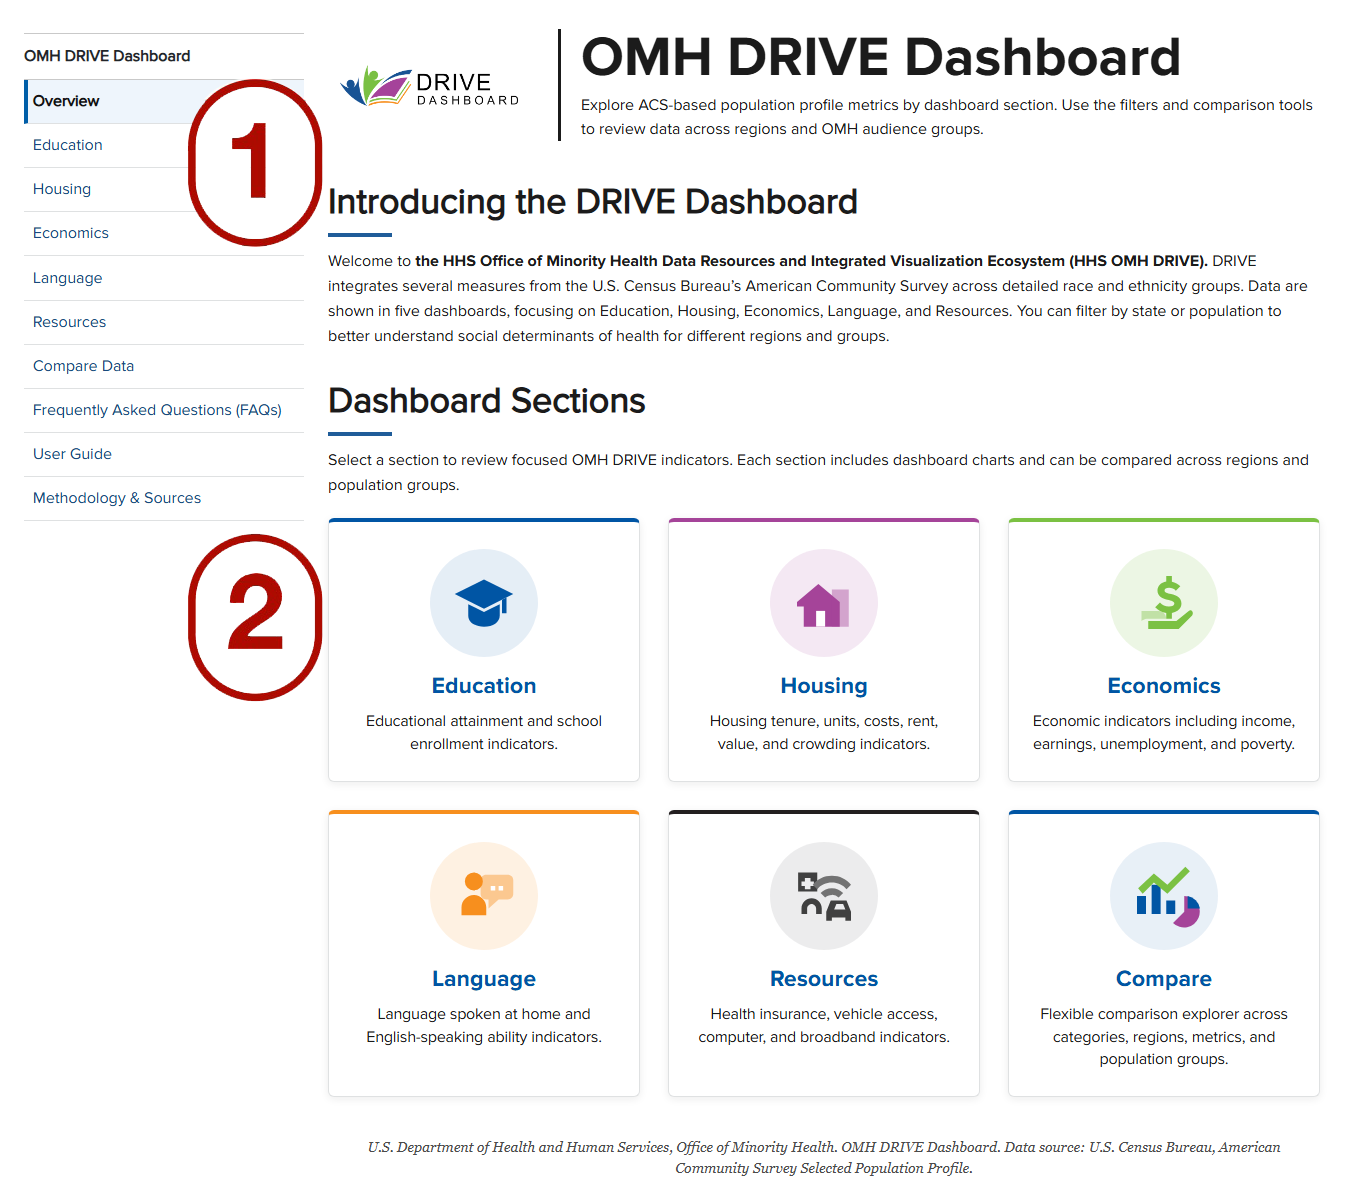
OMH DRIVE’s home page includes the Dashboard sections as a list (part 1) or as buttons (part 2).
Key Factors
- Select one of the five key factors (Education, Housing, Economics, Language, or Resources) by clicking a key factor from the side list (part 1) or one of the buttons (part 2).
- At the end of every key factor, there is a “View source data table” link.
Reporting
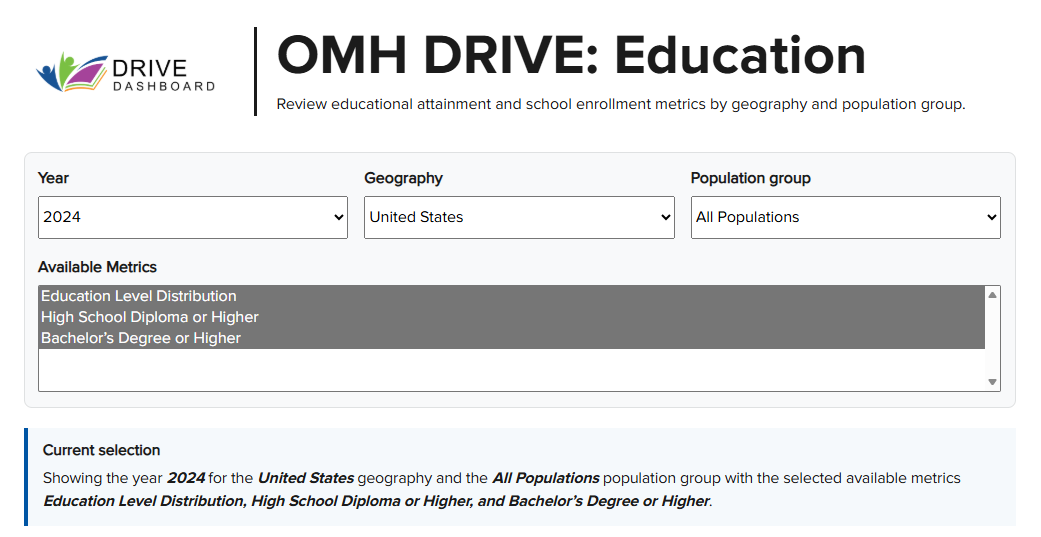
Within each key factor page, you can use the drop-down menus to filter available data by Year, Geography, or Population group. Similarly, there is a list of Available Metrics specific to each of the five key factors.
The Available Metrics will be updated based on the selected Year, Geography, and Population group.
DRIVE’s current version includes data from:
Year: 2023, 2024
Geography: United States, each one of the 50 states, and the District of Columbia.
Population group (in alphabetical order):
- All populations
- American Indian and Alaska Native alone, not Hispanic or Latino
- Asian alone, not Hispanic or Latino
- Black or African American alone, not Hispanic or Latino
- Hispanic or Latino (of any race)
- Native Hawaiian and Other Pacific Islander alone, not Hispanic or Latino
- White alone, not Hispanic or Latino
For example, for Education, by default, OMH DRIVE shows the year 2024 for the United States geography and the All Populations population group with the selected available metrics Education Level Distribution, High School Diploma or Higher, and Bachelor’s Degree or Higher.
To compare regions/groups or years, please see Compare Data.
OMH DRIVE Labels
To accommodate character limits within drop-down menu fields, many race and ethnicity category names in OMH DRIVE have been shortened into OMH DRIVE Labels. These abbreviated labels are used solely to display categories within the selection interface.
OMH DRIVE Labels were created by applying a consistent set of abbreviation conventions, such as standardized shorthand for group names (e.g., "Alaska Native" to "AN"), condensed versions of recurring qualifying phrases (e.g., "alone or in combination with one or more other races, not Hispanic or Latino" to "alone/combo, NH"), and state postal abbreviations in place of full location names for tribal designations. Categories that already fit within the character limit were left unchanged.
The table below provides the complete crosswalk between each ACS category name and its corresponding OMH DRIVE Label, allowing users to identify the full category represented by any abbreviated entry in the drop-down menu.
| ACS Category Name | OMH DRIVE Label |
|---|---|
| All Populations | All Populations |
| Alaska Native tribes, specified, alone | AN tribes, specified, alone |
| Alaska Native tribes, specified, alone or in any combination | AN tribes, specified, alone or in any combination |
| American Indian and Alaska Native alone or in combination with one or more other races, not Hispanic or Latino | AIAN alone/combo, NH |
| American Indian and Alaska Native alone, not Hispanic or Latino | AIAN alone, NH |
| American Indian tribes, specified, alone | American Indian tribes, specified, alone |
| American Indian tribes, specified, alone or in any combination | American Indian tribes, specified, alone or in any combination |
| Argentinean | Argentinean |
| Asian alone or in combination with one or more other races, not Hispanic or Latino | Asian alone/combo, NH |
| Asian alone, not Hispanic or Latino | Asian alone, not Hispanic or Latino |
| Asian Indian alone | Asian Indian alone |
| Asian Indian alone or in any combination | Asian Indian alone or in any combination |
| Bangladeshi alone | Bangladeshi alone |
| Bangladeshi alone or in any combination | Bangladeshi alone or in any combination |
| Black or African American alone or in combination with one or more other races, not Hispanic or Latino | Black/African Am. alone/combo, NH |
| Black or African American alone, not Hispanic or Latino | Black/African Am. alone, NH |
| Blackfeet Tribe of the Blackfeet Indian Reservation of Montana alone or in any combination | Blackfeet Tribe (MT) alone/any combo |
| Bolivian | Bolivian |
| Burmese alone | Burmese alone |
| Burmese alone or in any combination | Burmese alone or in any combination |
| Cambodian alone | Cambodian alone |
| Cambodian alone or in any combination | Cambodian alone or in any combination |
| Central American | Central American |
| Chamorro alone | Chamorro alone |
| Chamorro alone or in any combination | Chamorro alone or in any combination |
| Chilean | Chilean |
| Chinese alone | Chinese alone |
| Chinese alone or in any combination | Chinese alone or in any combination |
| Chinese, except Taiwanese alone | Chinese, except Taiwanese alone |
| Chinese, except Taiwanese alone or in any combination | Chinese, except Taiwanese alone or in any combination |
| Colombian | Colombian |
| Costa Rican | Costa Rican |
| Cuban | Cuban |
| Dominican | Dominican |
| Ecuadorian | Ecuadorian |
| Filipino alone | Filipino alone |
| Filipino alone or in any combination | Filipino alone or in any combination |
| Guamanian or Chamorro alone | Guamanian or Chamorro alone |
| Guamanian or Chamorro alone or in any combination | Guamanian or Chamorro alone or in any combination |
| Guatemalan | Guatemalan |
| Hispanic or Latino (of any race) | Hispanic or Latino (of any race) |
| Hmong alone | Hmong alone |
| Hmong alone or in any combination | Hmong alone or in any combination |
| Honduran | Honduran |
| Indonesian alone | Indonesian alone |
| Indonesian alone or in any combination | Indonesian alone or in any combination |
| Japanese alone | Japanese alone |
| Japanese alone or in any combination | Japanese alone or in any combination |
| Korean alone | Korean alone |
| Korean alone or in any combination | Korean alone or in any combination |
| Laotian alone | Laotian alone |
| Laotian alone or in any combination | Laotian alone or in any combination |
| Mexican | Mexican |
| Micronesian alone | Micronesian alone |
| Micronesian alone or in any combination | Micronesian alone or in any combination |
| Native Hawaiian alone | Native Hawaiian alone |
| Native Hawaiian alone or in any combination | Native Hawaiian alone or in any combination |
| Native Hawaiian and Other Pacific Islander alone | Native Hawaiian and Other Pacific Islander alone |
| Native Hawaiian and Other Pacific Islander alone or in combination with one or more other races | NHPI alone/combo |
| Native Hawaiian and Other Pacific Islander alone or in combination with one or more other races, not Hispanic or Latino | NHPI alone/combo, NH |
| Native Hawaiian and Other Pacific Islander alone, not Hispanic or Latino | NHPI alone, NH |
| Nepalese alone | Nepalese alone |
| Nepalese alone or in any combination | Nepalese alone or in any combination |
| Nicaraguan | Nicaraguan |
| Not Hispanic or Latino | Not Hispanic or Latino |
| Pakistani alone | Pakistani alone |
| Pakistani alone or in any combination | Pakistani alone or in any combination |
| Panamanian | Panamanian |
| Peruvian | Peruvian |
| Polynesian alone | Polynesian alone |
| Polynesian alone or in any combination | Polynesian alone or in any combination |
| Puerto Rican | Puerto Rican |
| Salvadoran | Salvadoran |
| Samoan alone | Samoan alone |
| Samoan alone or in any combination | Samoan alone or in any combination |
| Some Other Race alone or in combination with one or more other races | SOR alone/combo |
| Some Other Race alone or in combination with one or more other races, not Hispanic or Latino | SOR alone/combo, NH |
| Some Other Race alone, not Hispanic or Latino | SOR alone, NH |
| South American | South American |
| Spaniard | Spaniard |
| Sri Lankan alone or in any combination | Sri Lankan alone or in any combination |
| Taiwanese alone | Taiwanese alone |
| Taiwanese alone or in any combination | Taiwanese alone or in any combination |
| Thai alone | Thai alone |
| Thai alone or in any combination | Thai alone or in any combination |
| Tongan alone or in any combination | Tongan alone or in any combination |
| Two or More Races | Two or More Races |
| Two or More Races, not Hispanic or Latino | Two or More Races, not Hispanic or Latino |
| Uruguayan | Uruguayan |
| Venezuelan | Venezuelan |
| Vietnamese alone | Vietnamese alone |
| Vietnamese alone or in any combination | Vietnamese alone or in any combination |
| White alone or in combination with one or more other races, not Hispanic or Latino | White alone/combo, NH |
| White alone, not Hispanic or Latino | White alone, not Hispanic or Latino |
Compare Data
- Within the Compare Data page, you will see three drop-down menus and four lists to select multiple available metrics.
- The options from the three drop-down menus (Comparison mode, Dashboard category, and Chart type) can be selected one at a time per drop-down menu.
- The metrics from the four lists can be selected using the CTRL + metric for individual selection or SHIFT + metrics for multiple metrics.
- There is a Current selection text box that highlights the selected options from the drop-down menus and the four lists. See example below:

| Drop-down menu options | |
|---|---|
| Comparison mode | Compare regions/groups (i.e., United States, any of the 50 states, District of Columbia) |
| Compare years (i.e., 2023, 2024) | |
| Dashboard category | Education |
| Housing | |
| Economics | |
| Language | |
| Resources | |
| Chart type | Grouped column |
| Horizontal bar | |
| Line | |
| List options | |
|---|---|
| Year | 2023 |
| 2024 | |
| Available metrics | 13 metrics for Education |
| 16 metrics for Housing | |
| 9 metrics for Economics | |
| 4 metrics for Language | |
| 5 metrics for Resources | |
| Regions | United States |
| All 50 states | |
| District of Columbia | |
| Population group (in alphabetical order) | All populations |
| American Indian and Alaska Native alone, not Hispanic or Latino | |
| Asian alone, not Hispanic or Latino | |
| Black or African American alone, not Hispanic or Latino | |
| Hispanic or Latino (of any race) | |
| Native Hawaiian and Other Pacific Islander alone, not Hispanic or Latino | |
| White alone, not Hispanic or Latino | |
To go back to the Overview, key factor, or Compare Data pages, click on the corresponding title from the side list. See image below: